Problem:
R的圖形輸出其畫質會變得不是很清晰等問題.
Analysis:
R中可以採用多種不同輸出格式, 其中以 pdf 格式較佳, 如果 tiff , eps 有做參數調整, 應該也是不錯的選擇, 詳細設定參考 ?tiff , ?pdf 指令。在 RStudio 軟體中亦可直接選取 Export \ Save Plot as Image ... 輸出圖檔, 參考以下 R codes.
graphics-export.R
pdf原圖

pdf 放大200%

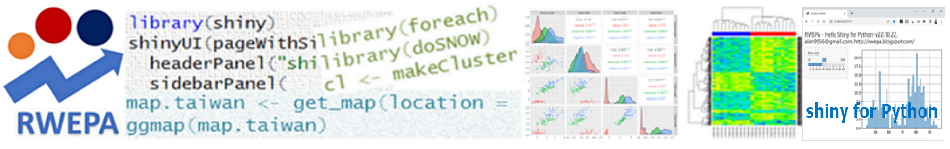
歡迎來到 RWEPA blog, 成立宗旨為提供免費R(Python)等資訊。R(Python)包括大量套件可應用於不同領域, 例如: 2D/3D互動式繪圖, 資料視覺化, 地理視覺化, 資料探勘, 機器學習, 深度學習, 線性與非線性最佳化問題, 時間序列, 空間資料, 財務分析, 多變量分析, 問卷調查, 實驗設計, 統計製程管制, 存活分析, 臨床實驗分析, 社會網絡分析, 生物資訊, 醫學統計, 水文學, 天文學等。

# Settings \Keyboard \ Input Sources \ 選取 Chinese(QuickClassic) , Chinese(Zhuyin)


