
範例: 育達科技大學在哪裡, 標示主要交通方式.
說明:
1. 先找出 育達科技大學 的經, 緯度資料, 方法: 在Google Map 中輸入"育達科技大學 ", 在地圖中選取該位置 \ 按 右鍵 \ 這是哪裹?畫面上方顯示 24.650138,120.847179 即為經度, 緯度.
2. 同理依序找出下列位置度, 緯度:
竹南交流道 Zhunan Intercept
頭份交流道 Toufen Intercept
竹南火車站 Zhunan Station
3. 參考以下程式碼: R-YuDa-map-RgoogleMaps.R
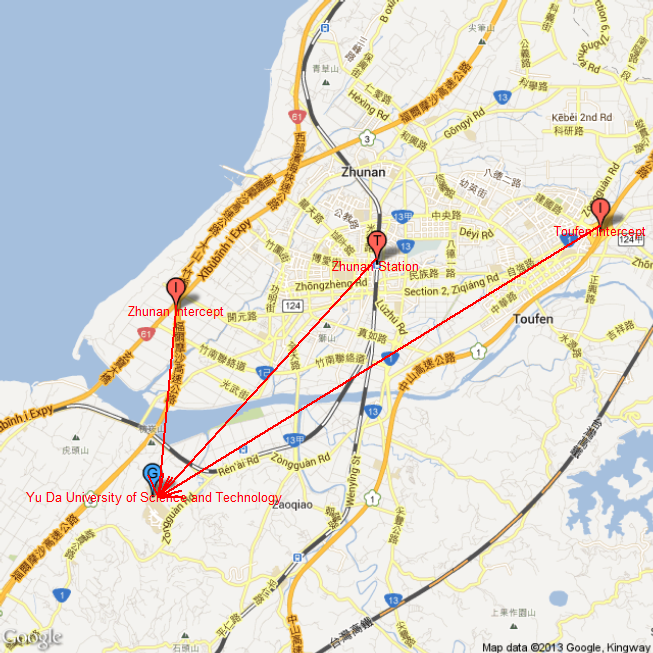
# title: maps with RgoogleMaps package
# date: 2013.9.6

library(RgoogleMaps)
# location: YuDa University, Zhunan Station, Zhunan and Toufen Intercept
lats <- c( 24.650138, 24.686601, 24.679427, 24.691631)
lons <- c(120.847179, 120.88063, 120.846945, 120.918313)
center <- c(mean(lats), mean(lons))
zoom <- min(MaxZoom(range(lats), range(lons)))

# download a static map from the Google server
MyMap <- GetMap(center=center, zoom=zoom, markers = "&markers=color:blue|label:G|24.651113,120.842976&markers=color:red|label:T|24.686601,120.88063&markers=color:red|color:red|label:I|24.679427,120.846945&markers=color:red|color:red|label:I|24.691631,120.918313", destfile="YuDa-map.png")

# add arrows
s <- seq(length(lats)-1)
PlotArrowsOnStaticMap(MyMap, lat0=lats[1], lon0=lons[1]+0.001, lat1=lats[s+1]+0.001, lon1=lons[s+1], col='red', lwd=2, code=1)

# add texts
TextOnStaticMap(MyMap, lat=lats[1],lon=lons[1], "Yu Da University of Science and Technology", cex=0.8, col='red', add=TRUE)
TextOnStaticMap(MyMap, lat=lats[2],lon=lons[2], "Zhunan Station", cex=0.8, col='red', add=TRUE)
TextOnStaticMap(MyMap, lat=lats[3],lon=lons[3], "Zhunan Intercept", cex=0.8, col='red', add=TRUE)
TextOnStaticMap(MyMap, lat=lats[4],lon=lons[4], "Toufen Intercept", cex=0.8, col= 'red', add=TRUE)
# end
4. 連結四個位置與箭頭之結果.
沒有留言:
張貼留言