# ggplot2
# scale
# hcl
# ggtitle
# theme
本篇文章說明 ggplot2 繪圖的顏色主題,內容包括:
1. 使用標準單一顏色.
2. 使用ggplot2內建群組顏色.
3. 使用scales套件,檢視繪圖資訊.
4. 使用客製化 hcl {grDevices}
1. 使用標準單一顏色.
2. 使用ggplot2內建群組顏色.
3. 使用scales套件,檢視繪圖資訊.
4. 使用客製化 hcl {grDevices}
套件:
1. ggplot2 - 使用ggplot2套件繪圖
2. scales - 擷取ggplot2套件的繪圖資訊
1. ggplot2 - 使用ggplot2套件繪圖
2. scales - 擷取ggplot2套件的繪圖資訊
3. gridExtra - 進行多列多行 ggplot2 繪圖
R程式碼下載:
R程式碼:
library(ggplot2)
# 方法1 使用標準單一顏色
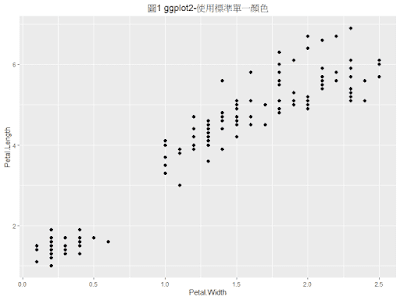
ggplot(iris, aes(Petal.Width, Petal.Length)) +
geom_point(size=2) +
ggtitle("圖1 ggplot2-使用標準單一顏色") +
theme(plot.title = element_text(hjust = 0.5))
# 方法2 使用ggplot2內建群組顏色
ggplot(iris, aes(Petal.Width, Petal.Length, color=Species)) +
geom_point(size=2) +
ggtitle("圖2 ggplot2-使用內建群組顏色") +
theme(plot.title = element_text(hjust = 0.5))
# 方法3 使用scales套件,檢視繪圖資訊.
library(scales)
p <- ggplot(iris, aes(Petal.Width, Petal.Length, group=Species)) +
geom_point(aes(color=Species), size=2)
# ggplot2使用的繪圖顏色
# ggplot_build {scale} 可擷取ggplot2繪圖的相關資訊等
col <- unique(ggplot_build(p)$data[[1]]$colour)
# 顯示ggplot2使用的繪圖顏色
show_col(col) # "#F8766D" "#00BA38" "#619CFF" (紅綠藍)
# 將所有顏色轉換成 factor, 加上 levels 參數, 以免顏色異常.
mycol <- factor(ggplot_build(p)$data[[1]]$colour,
levels = c("#F8766D", "#00BA38", "#619CFF"))
# 使用 gridExtra 套件進行多列,多行繪圖, 類似 par(mfrow=c(1,2))功能
library(gridExtra)
p1 <- ggplot(iris, aes(Petal.Width, Petal.Length)) +
geom_point(aes(color=Species), size=2) +
ggtitle("圖3 ggplot2-使用預設顏色") +
theme(plot.title = element_text(hjust = 0.5))
p2 <- ggplot(iris, aes(Petal.Width, Petal.Length)) +
geom_point(aes(color=mycol), size=2) +
ggtitle("圖4 ggplot2-使用scales套件(二者相同") +
theme(plot.title = element_text(hjust = 0.5))
# 設定1列, 2行繪圖
# 右側圖例有改善空間!
grid.arrange(p1, p2, nrow=1, ncol=2)
# 方法4 使用客製化 hcl {grDevices}
# ggplot2 內部使用 HCL 顏色規範,參考孟塞爾顏色系統 (Munsell Color System)
# 色相(hue)指的是色彩的外相,表示在不同波長的光照射下,人眼所感覺不同的顏色.
# 在HSL和HSV色彩空間中, H指的就是色相,以紅色為0度(360度);黃色為60度;綠色為120度;青色為180度;藍色為240度;品紅色為300度.
# hcl(h = 0, c = 35, l = 85, alpha, fixup = TRUE)
# h(hue 色相): The hue of the color specified as an angle in the range [0,360].
# 0 yields red, 120 yields green 240 yields blue, etc.
# c(chroma 色度): The chroma of the color. The upper bound for chroma depends on hue and luminance.
# l(value 明度): A value in the range [0,100] giving the luminance of the colour. For a given combination of hue and chroma, only a subset of this range is possible.
# hue 色相 : 0~360度表示
# chroma 色度 : 中間為0, 向外擴散增加
# value 明度 : 南北上下軸表示明度(value)的深淺, 從全黑(N0)至全灰(N5)到全白(N10)
gg_color_hue <- function(n) {
hues = seq(15, 375, length = n + 1) # seq(0, 360, ...)
hcl(h = hues, l = 65, c = 100)[1:n]
}
n <- 3
gg_color_hue(n) # "#F8766D" "#00BA38" "#619CFF"
cols <- factor(rep(gg_color_hue(n), each = 50),
levels = c("#F8766D", "#00BA38", "#619CFF"),
labels = c("setosa", "versicolor", "virginica"))
ggplot(iris, aes(Petal.Width, Petal.Length, color=cols)) +
geom_point(size=2) +
ggtitle("圖5 ggplot2-使用客製化hcl函數") +
theme(plot.title = element_text(hjust = 0.5)) +
scale_colour_discrete("Species") +
theme(legend.title.align=0.5)
# end


沒有留言:
張貼留言