顯示具有 graphics 標籤的文章。 顯示所有文章

2020年9月20日 星期日

ggplot2 套件 - hcl 客製化繪圖顏色 (customized color)


# ggplot2
# scale
# hcl
# ggtitle
# theme

本篇文章說明 ggplot2 繪圖的顏色主題,內容包括:
1. 使用標準單一顏色.
2. 使用ggplot2內建群組顏色.
3. 使用scales套件,檢視繪圖資訊.
4. 使用客製化 hcl {grDevices}

套件:
1. ggplot2 - 使用ggplot2套件繪圖
2. scales - 擷取ggplot2套件的繪圖資訊
3. gridExtra - 進行多列多行 ggplot2 繪圖


R程式碼下載:

R程式碼:
library(ggplot2)

# 方法1 使用標準單一顏色
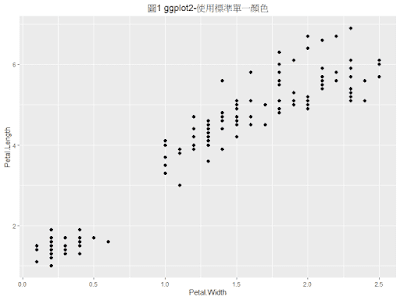
ggplot(iris, aes(Petal.Width, Petal.Length)) +
  geom_point(size=2) +
  ggtitle("圖1 ggplot2-使用標準單一顏色") +
  theme(plot.title = element_text(hjust = 0.5))

圖1 ggplot2-使用標準單一顏色


# 方法2 使用ggplot2內建群組顏色
ggplot(iris, aes(Petal.Width, Petal.Length, color=Species)) +
  geom_point(size=2) +
  ggtitle("圖2 ggplot2-使用內建群組顏色") +
  theme(plot.title = element_text(hjust = 0.5))

圖2 ggplot2-使用內建群組顏色


# 方法3 使用scales套件,檢視繪圖資訊.
library(scales)

p <- ggplot(iris, aes(Petal.Width, Petal.Length, group=Species)) +
  geom_point(aes(color=Species), size=2)

# ggplot2使用的繪圖顏色
# ggplot_build {scale} 可擷取ggplot2繪圖的相關資訊等
col <- unique(ggplot_build(p)$data[[1]]$colour)

# 顯示ggplot2使用的繪圖顏色
show_col(col) # "#F8766D" "#00BA38" "#619CFF" (紅綠藍)

# 將所有顏色轉換成 factor, 加上 levels 參數, 以免顏色異常.
mycol <- factor(ggplot_build(p)$data[[1]]$colour, 
                levels = c("#F8766D", "#00BA38", "#619CFF"))

# 使用 gridExtra 套件進行多列,多行繪圖, 類似 par(mfrow=c(1,2))功能
library(gridExtra)

p1 <- ggplot(iris, aes(Petal.Width, Petal.Length)) +
  geom_point(aes(color=Species), size=2) +
  ggtitle("圖3 ggplot2-使用預設顏色") +
  theme(plot.title = element_text(hjust = 0.5))

p2 <- ggplot(iris, aes(Petal.Width, Petal.Length)) +
  geom_point(aes(color=mycol), size=2) +
  ggtitle("圖4 ggplot2-使用scales套件(二者相同") +
  theme(plot.title = element_text(hjust = 0.5))

# 設定1列, 2行繪圖
# 右側圖例有改善空間!
grid.arrange(p1, p2, nrow=1, ncol=2)

圖3, 圖4 ggplot2-使用scales套件(二者相同


# 方法4 使用客製化 hcl {grDevices}

# ggplot2 內部使用 HCL 顏色規範,參考孟塞爾顏色系統 (Munsell Color System)


# 色相(hue)指的是色彩的外相,表示在不同波長的光照射下,人眼所感覺不同的顏色.
# 在HSL和HSV色彩空間中, H指的就是色相,以紅色為0度(360度);黃色為60度;綠色為120度;青色為180度;藍色為240度;品紅色為300度.

# hcl(h = 0, c = 35, l = 85, alpha, fixup = TRUE)

# h(hue 色相): The hue of the color specified as an angle in the range [0,360].
# 0 yields red, 120 yields green 240 yields blue, etc.

# c(chroma 色度): The chroma of the color. The upper bound for chroma depends on hue and luminance.

# l(value 明度): A value in the range [0,100] giving the luminance of the colour. For a given combination of hue and chroma, only a subset of this range is possible.

# hue 色相    : 0~360度表示
# chroma 色度 : 中間為0, 向外擴散增加
# value 明度  : 南北上下軸表示明度(value)的深淺, 從全黑(N0)至全灰(N5)到全白(N10)


gg_color_hue <- function(n) {
  hues = seq(15, 375, length = n + 1) # seq(0, 360, ...)
  hcl(h = hues, l = 65, c = 100)[1:n]
}

n <- 3

gg_color_hue(n) # "#F8766D" "#00BA38" "#619CFF"

cols <- factor(rep(gg_color_hue(n), each = 50),
               levels = c("#F8766D", "#00BA38", "#619CFF"),
               labels = c("setosa", "versicolor", "virginica"))

ggplot(iris, aes(Petal.Width, Petal.Length, color=cols)) +
  geom_point(size=2) +
  ggtitle("圖5 ggplot2-使用客製化hcl函數") +
  theme(plot.title = element_text(hjust = 0.5)) +
  scale_colour_discrete("Species") +
  theme(legend.title.align=0.5)


# end

2019年10月13日 星期日

資料視覺化於相關性分析-弦圖 (Chord Diagram)


更新日期: 2022.6.7


配合新版 R-4.2.0 使用以下任何一種方法重新安裝chorddiag套件:

# 方法1 

install_github 函數, 重新安裝套件.

devtools::install_github("mattflor/chorddiag")

# 方法2 

下載以下更新 zip 檔案, 使用 install.packages 函數安裝.


install.packages("chorddiag.zip", repos = NULL, type = "win.binary")

更新日期: 2020.6.11

配合新版 R-4.0.0 可使用以下指令, 重新安裝套件

devtools::install_github("mattflor/chorddiag", force = TRUE)

更新日期: 2019.10.17

在 Windows 環境中, 使用 devtools::install_github("mattflor/chorddiag") 函數會有顯示錯誤, 此時可考慮下載以下  chorddiag.zip 檔案, 在 RStudio 軟體中, 直接安裝此套件.

https://github.com/rwepa/DataDemo/blob/master/chorddiag.zip

RStudio \ 選取右下角 Packages \ Install \ Install from: 改為 [Package Archive File (.zip, .tar.gz)] \ 選取 chorddiag.zip \ 按 Open \ 按 Install 即可.
# end

資料視覺化於相關性分析-弦圖 (Chord Diagram)

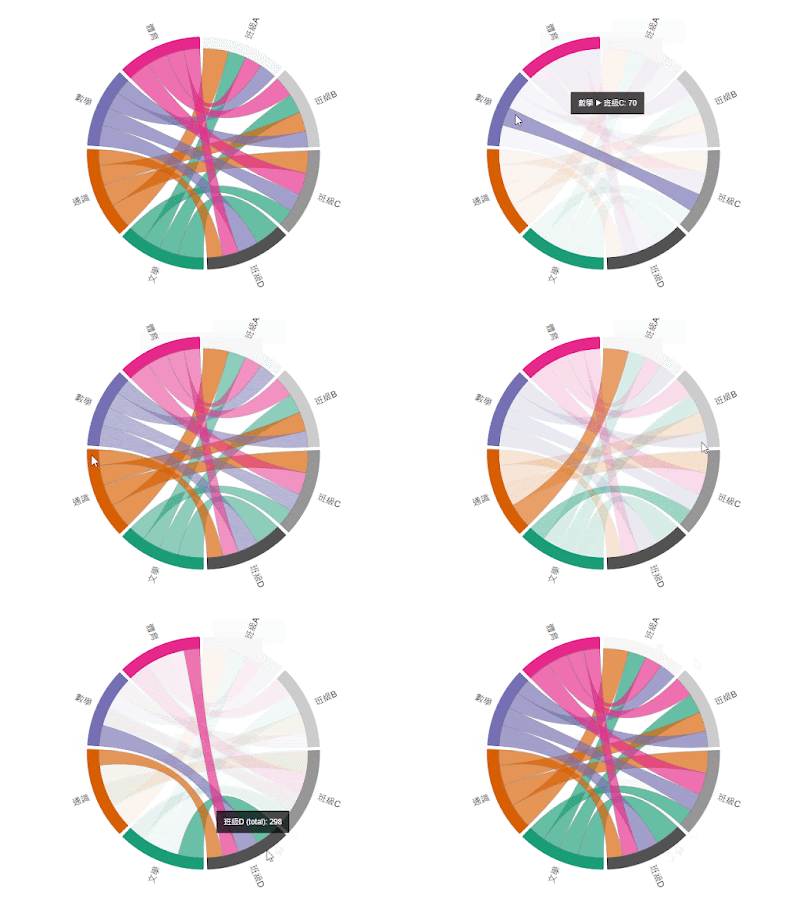
本篇文章介紹 R 軟體在大量資料的相關性資料視覺化應用, 大量數值資料結果有時不易看出資料的樣式 (Patterns), 此時可使用弦圖以建立視覺化結果.
弦圖 (Chord Diagram, Chordal Graph) 參考: https://en.wikipedia.org/wiki/Chordal_graph


說明:

1. Windows 系統中, 先安裝 Rtools 編譯工具, 此工具可以下載並安裝相關套件.

  • 連結至 Rtools 網站, 例如: http://cran.csie.ntu.edu.tw/bin/windows/Rtools/
  • 下載最新版本 Rtools35.exe (約104MB)
  • 安裝 Rtools 軟體, 全部採用預設值安裝,
    例: 安裝目錄為 C:\Rtools
    例: Add rtools to system PATH 選項記得打勾

2. 安裝 devtools 套件, 使用 install.packages("devtools")

3. 安裝 chorddiag 套件進行弦圖資料視覺化, 此套件非 CRAN 標準套件, 可使用 devtools 套件中的 install_github 函數進行套件之安裝.

安裝指令 devtools::install_github("mattflor/chorddiag")

參考網站: https://github.com/mattflor/chorddiag

套件使用時, 輸入資料必須採用矩陣資料 (matrix), 且行與列的個數須相同.

繪製弦圖函數為 chorddiag.

R程式碼:

# title: chord diagram
# date: 2019.10.13

# 安裝 Windows 版本 Rtools
# http://cran.csie.ntu.edu.tw/bin/windows/Rtools/
# 安裝時, Add rtools to system PATH 記得打勾

# 安裝 devtools 套件
install.packages("devtools")

# 安裝 chorddiag 套件
devtools::install_github("mattflor/chorddiag")

# 載入套件
library(chorddiag)

# 建立資料
students <- as.matrix(data.frame(
  文學 = c(68, 75, 65, 97),
  通識 = c(96, 75, 85, 60),
  數學 = c(65, 61, 70, 80),
  體育 = c(66, 79, 85, 61)))

row.names(students) <- c("班級A", "班級B", "班級C", "班級D")

# 繪製弦圖
chorddiag(students)

# 視覺化進階優化1
chorddiag(students, type = "bipartite")

# 視覺化進階優化2
chorddiag(students, type = "bipartite", showTicks = FALSE)

# 視覺化進階優化3
chorddiag(students, type = "bipartite", showTicks = FALSE, groupnameFontsize = 14, groupnamePadding = 10, margin = 90)
# end

2018年10月27日 星期六

主題式地圖(Thematic map) - 政府開放資料為例


# 主題式地圖
# Thematic map
# 開放式資料
# open data
# 地圖資料與社會經濟資料合併
# rgdal 套件
# tmap 套件

2022.7.28 更新R程式碼

# end

主題
本例說明考量社會經濟等開放式資料,輔以主題式繪圖方式,提升資料視覺化品質,便於資料呈現與溝通。下載資料的儲存目錄以C:\rdata為主。本範例包括以下六大步驟:

步驟1:下載社會經濟開放資料
步驟2:下載地圖資料
步驟3:匯入地圖資料至R
步驟4:匯入臺北市住宅竊盜點位資訊資料
步驟5:將臺北市住宅竊盜點位資訊整合至twn.taipei@data
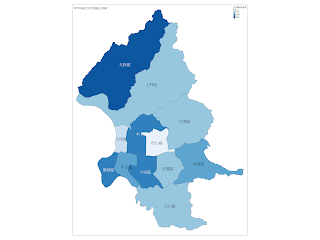
步驟6:臺北市住宅竊盜分佈圖

步驟1:下載社會經濟開放資料

本例以臺北市住宅竊盜點位資訊為例,資料筆數;1945,欄位個數:5,欄位名稱:編號,案類,發生(現)日期,發生時段,發生(現)地點。下載檔案:「臺北市10401-10709住宅竊盜點位資訊.csv」 。

下載網址:https://data.gov.tw/dataset/73886,參考圖-1,圖-2說明。


圖1-開放資料-臺北市住宅竊盜點位資訊


圖2-臺北市住宅竊盜點位資訊CSV檔案

目前資料集已經下架, 請參考以下網址直接下載:

步驟2:下載地圖資料

參考政府資料開放平台,常用的地理資料包括下列二個項目:

1. 鄉鎮市區界線(TWD97經緯度),資料包括鄉(鎮、市、區)行政區域界線圖資。

下載網址:https://data.gov.tw/dataset/7441,參考圖-3說明。


圖3-鄉鎮市區界線下載

2. 直轄市、縣市界線(TWD97經緯度),資料包括直轄市以及縣(市)行政區域界線圖資

下載網址:https://data.gov.tw/dataset/7442,參考圖-4說明。

圖4-直轄市、縣市界線下載

本例考量分析台北市各區資料,因此下載第一項「 鄉鎮市區界線(TWD97經緯度)」,下載檔案為「 mapdata201805311056.zip」,解壓縮為「C:\rdata\mapdata201805311056」資料夾,參考圖-5說明。

地圖資料包括 .shp, .shx, .dbf, .prj,其中shp, shx, dbf 為三個必備檔案:
  • .shp:圖形格式,用於儲存地圖元素的幾何資料。
  • .shx:— 圖形索引格式,即幾何資料索引。記錄每一個幾何資料shp檔案之中的位置,能夠加快向前或向後搜尋幾何資料的效率。
  • .dbf:屬性資料格式,以dBase IV的資料表格式儲存每個幾何形狀的屬性資料。
  • .prj:圖形格式.shp檔案中幾何資料所使用的經緯度座標系統。


圖5-鄉鎮市區界線(TWD97經緯度)解壓資料夾

步驟3:匯入地圖資料至R

使用 rgdal 套件的 readOGR函數 以匯入地圖資料,使用 tmap 套件以製作主題式地圖

library(rgdal)
library(tmap)

# 匯入地理資料 readOGR {rgdal}
twn <- readOGR(dsn="C:/rdata/mapdata201805311056", layer="TOWN_MOI_1070516", encoding="UTF-8")
head(twn@data) # 中文亂碼

# 中文亂碼轉換 iconv {base}
twn@data$COUNTYNAME <- iconv(twn@data$COUNTYNAME, from = "UTF-8", to="UTF-8")
twn@data$TOWNNAME <- iconv(twn@data$TOWNNAME, from = "UTF-8", to="UTF-8")
head(twn@data) # 中文正常顯示

names(attributes(twn)) # 7個屬性
summary(twn) # 資料摘要
names(twn) # 7個欄位
class(twn) # SpatialPolygonsDataFrame
str(twn@data) # 368*7

# 篩選臺北市地理資料
twn.taipei <- twn[which(twn@data$COUNTYNAME == "臺北市"), ]
twn.taipei@data

str(twn.taipei@polygons[1])
str(twn.taipei@polygons[5])

步驟4:匯入臺北市住宅竊盜點位資訊資料

theft <- read.table("臺北市10401-10709住宅竊盜點位資訊.csv", header=TRUE, sep=",", stringsAsFactors=FALSE) # 2054*5

# 將發生.現.日期由民國年轉為西元年
theft$發生.現.日期 <- as.Date(unlist(lapply(theft$發生.現.日期, function(x) {
  if (nchar(x) == 6) return(paste0(as.numeric(substr(x,1,2))+1911, "-", substr(x,3,4), "-", substr(x,5,6)))
  if (nchar(x) == 7) return(paste0(as.numeric(substr(x,1,3))+1911, "-", substr(x,4,5), "-", substr(x,6,7)))
})))

# 新增行政區欄位
# substr 函數與 Excel =MID函數 類似, 取出部分字串
theft$行政區 <- substr(theft$發生.現.地點,4,6)

# 篩選2018年&台北市資料
theft.2018 <- theft[theft$發生.現.日期 >= as.Date("2018-01-01") &  substr(theft$發生.現.地點,1,3) == "台北市" ,] # 247*6

# 樞紐分析各行政區住宅竊盜次數小計
theaft.area <- aggregate(案類~行政區, data=theft.2018[c(2,6)], length)
names(theaft.area) <- c("行政區", "住宅竊盜發生數")
summary(theaft.area)

步驟5:將臺北市住宅竊盜點位資訊整合至twn.taipei@data

# merge函數中,sort參數須設定為FALSE,否則繪圖位置會有錯誤
twn.taipei@data <- merge(twn.taipei@data, theaft.area, by.x = "TOWNNAME", by.y = "行政區", sort=FALSE)
twn.taipei@data

步驟6:臺北市住宅竊盜分佈圖

# method 1 採用 plot{graphics}
住宅竊盜發生數.color <- cut(twn.taipei@data$住宅竊盜發生數,
                     breaks=c(0,10,15,20,30,Inf),
                     labels=c("10以下", "11~15", "16~20", "21~30", "31以上"))

# 建立彩色調色盤(color palette)
# 內建調色盤 rainbow, heat.colors, terrain.colors, topo.colors, cm.colors, 本例以heat.colors為主
twn.taipei@data$Col <- heat.colors(5)[as.numeric(住宅竊盜發生數.color)]

plot(twn.taipei, col=twn.taipei@data$Col, main="2018年臺北市住宅竊盜分佈圖")
text(coordinates(twn.taipei)[,1], coordinates(twn.taipei)[,2], twn.taipei$TOWNNAME, cex=0.7)
legend("topright", legend=levels(住宅竊盜發生數.color), fill=twn.taipei@data$Col, col= heat.colors(5), title="住宅竊盜發生數")

# method 2 採用 qtm{tmap}
qtm(shp=twn.taipei, fill="住宅竊盜發生數", text="TOWNNAME", fill.title="住宅竊盜發生數", title="2018年臺北市住宅竊盜分佈圖")


qtm(shp=twn.taipei, fill="住宅竊盜發生數", text="TOWNNAME", fill.title="住宅竊盜發生數", title="2018年臺北市住宅竊盜分佈圖", fill.palette="Blues")


qtm(shp=twn.taipei, fill="住宅竊盜發生數", text="TOWNNAME", fill.title="住宅竊盜發生數", title="2018年臺北市住宅竊盜分佈圖", fill.palette="Greens")

R程式碼 :
# title: 主題式地圖(Thematic map)-以政府開放資料為例
# date: 2018.10.28
# 本例說明考量社會經濟等開放式資料,輔以主題式繪圖方式,提升資料視覺化品質,使於資料呈現與溝通。

# 步驟1:
# 下載社會經濟等開放式資料,本例以臺北市住宅竊盜點位資訊為例,資料筆數;1945,欄位個數:5,欄位名稱:編號,案類,發生(現)日期,發生時段,發生(現)地點。
# 下載網址:https://data.gov.tw/dataset/73886

# 步驟2:下載地圖資料
# 本例考量分析台北市各區資料,因此下載第一項「 鄉鎮市區界線(TWD97經緯度)」,下載檔案為「 mapdata201805311056.zip」,解壓縮為「C:\rdata\mapdata201805311056」資料夾

# 下載世界地圖
# http://www.diva-gis.org/gdata


# 步驟3:匯入地圖資料至R
# 使用 rgdal 套件的 readOGR函數 以匯入地圖資料,使用 tmap 套件以製作主題式地圖

library(rgdal)
library(tmap)

# 匯入地理資料
twn <- readOGR(dsn="C:/rdata/mapdata201805311056", layer="TOWN_MOI_1070516", encoding="UTF-8")
head(twn@data) # 中文亂碼

# twn <- readOGR(dsn="C:/rdata/TWN_adm", layer="TWN_adm1", encoding="UTF-8")
head(twn@data) # 中文亂碼
names(twn@data)

# 中文亂碼轉換 iconv
twn@data$COUNTYNAME <- iconv(twn@data$COUNTYNAME, from = "UTF-8", to="UTF-8")
twn@data$TOWNNAME <- iconv(twn@data$TOWNNAME, from = "UTF-8", to="UTF-8")
head(twn@data) # 中文正常顯示

names(attributes(twn)) # 7個屬性
summary(twn) # 資料摘要
names(twn) # 7個欄位
class(twn) # SpatialPolygonsDataFrame
str(twn@data) # 368*7

# 篩選臺北市地理資料
twn.taipei <- twn[which(twn@data$COUNTYNAME == "臺北市"), ]
twn.taipei@data

str(twn.taipei@polygons[1])
str(twn.taipei@polygons[5])

# 步驟4:匯入臺北市住宅竊盜點位資訊資料
theft <- read.table("臺北市10401-10709住宅竊盜點位資訊.csv", header=TRUE, sep=",", stringsAsFactors=FALSE) # 2054*5

# 將發生.現.日期由民國年轉為西元年
theft$發生.現.日期 <- as.Date(unlist(lapply(theft$發生.現.日期, function(x) {
 if (nchar(x) == 6) return(paste0(as.numeric(substr(x,1,2))+1911, "-", substr(x,3,4), "-", substr(x,5,6)))
 if (nchar(x) == 7) return(paste0(as.numeric(substr(x,1,3))+1911, "-", substr(x,4,5), "-", substr(x,6,7)))
})))

# 新增行政區欄位
theft$行政區 <- substr(theft$發生.現.地點,4,6)

# 篩選2018年&台北市資料
theft.2018 <- theft[theft$發生.現.日期 >= as.Date("2018-01-01") & substr(theft$發生.現.地點,1,3) == "台北市" ,] # 247*6

# 樞紐分析各行政區住宅竊盜次數小計
theaft.area <- aggregate(案類~行政區, data=theft.2018[c(2,6)], length)
names(theaft.area) <- c("行政區", "住宅竊盜發生數")
summary(theaft.area)

# 步驟5:將臺北市住宅竊盜點位資訊資料整合至 twn.taipei@data
# merge函數中,sort參數須設定為FALSE,否則繪圖位置會有錯誤
twn.taipei@data <- merge(twn.taipei@data, theaft.area, by.x = "TOWNNAME", by.y = "行政區", sort=FALSE)
twn.taipei@data

# 步驟6:臺北市住宅竊盜分佈圖

# method 1 採用 plot{graphics}
住宅竊盜發生數.color <- cut(twn.taipei@data$住宅竊盜發生數, 
 breaks=c(0,10,15,20,30,Inf), 
 labels=c("10以下", "11~15", "16~20", "21~30", "31以上"))

# 建立彩色調色盤(color palette)
# 內建調色盤 rainbow, heat.colors, terrain.colors, topo.colors, cm.colors, 本例以heat.colors為主
twn.taipei@data$Col <- heat.colors(5)[as.numeric(住宅竊盜發生數.color)]

plot(twn.taipei, col=twn.taipei@data$Col, main="2018年臺北市住宅竊盜分佈圖")
text(coordinates(twn.taipei)[,1], coordinates(twn.taipei)[,2], twn.taipei$TOWNNAME, cex=0.7)
legend("topright", legend=levels(住宅竊盜發生數.color), fill=twn.taipei@data$Col, col= heat.colors(5), title="住宅竊盜發生數")

# method 2 採用 qtm{tmap}
qtm(shp=twn.taipei, fill="住宅竊盜發生數", text="TOWNNAME", fill.title="住宅竊盜發生數", title="2018年臺北市住宅竊盜分佈圖")

qtm(shp=twn.taipei, fill="住宅竊盜發生數", text="TOWNNAME", fill.title="住宅竊盜發生數", title="2018年臺北市住宅竊盜分佈圖", fill.palette="Blues")

qtm(shp=twn.taipei, fill="住宅竊盜發生數", text="TOWNNAME", fill.title="住宅竊盜發生數", title="2018年臺北市住宅竊盜分佈圖", fill.palette="Greens")
# end

2018年2月16日 星期五

R與2018年狗年行大運 ^_^

在上一篇文章 [R與2017年金雞報喜^_^] 提及使用 cowsay 套件可繪製金雞報喜, 目前套件包括37種動物, 今年2018年沒有內建狗的資料, 因此本篇文章採建立新資料方式, 並繪製狗年行大運圖形, 參考以下範例:

關鍵字:

  • cowsay 套件
  • 2018年
  • dog

R程式:

# title: cowsay-狗年行大運
library(cowsay)
animals[38] <- 
'
<<              /-----\\\n
<<____________/ ( )    \\-o\n
|                   __/\n
<    狗年行大運 ^_^ / \n
(  ^_   ------\  << \n
< <  < \\       \\ \\ >> \n
\\_|  \\_|      /_/ //'

cat(animals[38])

繪圖結果:


# end

2016年11月27日 星期日

R與2017年金雞報喜 ^_^

近日發現有趣的 cowsay 套件, cowsay 是產生ASCII圖片的程式並可顯示一頭牛的訊息 (https://zh.wikipedia.org/wiki/Cowsay)。cowsay 套件內建34種ASCII圖片, 參考以下範例:

> library(cowsay)
> sort(names(animals))
 [1] "ant"          "anxiouscat"   "bat"          "bat2"         "behindcat"   
 [6] "bigcat"       "buffalo"      "cat"          "chicken"      "clippy"      
[11] "cow"          "endlesshorse" "facecat"      "fish"         "frog"        
[16] "ghost"        "grumpycat"    "hypnotoad"    "longcat"      "longtailcat" 
[21] "mushroom"     "pig"          "poop"         "pumpkin"      "rabbit"      
[26] "shark"        "shortcat"     "signbunny"    "smallcat"     "snowman"     
[31] "spider"       "stretchycat"  "trilobite"    "yoda"

使用 cat(cow) 即可畫出一頭牛的圖案.


使用 say("hello world!") 完成可愛的喵星人 ^_^


新的雞年即將來到, 先祝福R友 - 2017年金雞報喜.


# end